 As of January 2020, our team has chosen to broaden our Investment Evaluation Process of investment managers to include the fi360 Fiduciary Score®. Why? We feel that as a Fiduciary to our clients, we are required to act first and foremost with the needs of beneficiaries in mind. Our charge is to prudently select and monitor the investment managers we are recommending to our clients. We constantly want to be challenging our assumptions, beliefs, and systems so that we are always improving our decisions and recommendations to clients. Below is the process we undertook and what ultimately led us to including the fi360 Fiduciary Score® into our evaluation process.
Evaluation of our Current Scoring Metrics
Since 2012, Guidance Point Retirement Services investment team has been using several iterations of the following peer ranking and absolute value criteria by Morningstar category to screen, select, and monitor investment strategies for our clients:
- Expense Ratio
- Performance (3, 5, and 10 Year)
- Sharpe Ratio
- Turnover
- Assets in the Strategy
- Composition (how much of their assets match their stated Morningstar Category)
- Inception Date
- Manager Tenure
Our client reporting system, the fi360 Toolkit, has created a new system update with refreshed reports, tools, and efficiencies for teams like ours. With the new changes, monitoring and investment reporting improvements have been made that now allow us to adapt our above criteria to evaluate investments by management type (i.e. active investment or passive [index] investments) and limited investment types (i.e. target date funds, money market funds). Now that we can undergo improvements to how we display our results to Committees, we understandably have begun to ask ourselves if there are other changes we should be making.
From our self-analysis, one critique of our current practices is that we are evaluating the investment universe in a binary fashion i.e. either an investment strategy meets our criteria or does not. This binary evaluation allows us to know when failures are present, but does not allow us to judge severity of the failure. For example, an expense ratio of a fund may have 55 score, or in the top 55th percentile of all funds in the category. Our current scoring system would note that the fund has failed a required criterion and is now on the watch list. As the fund is on the watch list quarter over quarter, a prudent question from our internal team and committees evaluating the investments with us would be "is the investment improving or degrading in its watch list status?" This piece of information is helpful to know if a fund has a slight failure that may be improving and close to coming off the watchlist or the fund has a failure that is getting worse and should be more carefully considered for removal.

This key question prompted our team to come to the conclusion that we should not only consider the metrics we're using, but be weighting them and combining them into a numeric score. We debated over this concept heavily as we know the Committees with whom we work with appreciate the transparency into our metrics and that simply combining the metrics into a number could make our metrics "black-box-ish." Our work with clients has affirmed that they like when we're showing our work on why something is failing or passing, and we can exactly pinpoint a failure. Our team wanted to be careful about changes to the system on which our clients have given positive feedback.
Additionally, we are asking our process whether our evaluation categories and combined weightings are correct. Are these the correct categories to evaluate? Are there other categories that are better evaluators of a strategy's failures or more predictive of future performance? Even if we have found the correct categories to evaluate, what should the weighting of each category be in the decision-making process? What empirical evidence do we have that can provide proof that our process is creating better decisions and outcomes?
Honestly, all of the above questions are really difficult to answer. One process we could undertake would be to backtest every set of categories and weightings to select the highest performing strategies in previous time periods. However, as investable universes and strategies change over time to differing investing conditions, it would feel that we've simply created a process to get the "right" answers for the time periods we have cherry picked. Of more importance to us, and hopefully to our clients, is whether a chosen strategy today performs reasonably going forward. Equally important is the idea of watch list persistence, or that a strategy that when selected stays off of the watch list or is on the watch list for a limited period of time. Our binary watch list system has limitations to measure degree of failure in the future AND persistence.
Should we consider other ways to measure Investment Scoring & Evaluation?
Throughout the entirety of 2019, we reviewed many different scoring systems. This included all popular scoring systems that you would see from industry brands that may or may not be known to our client base including adapting our in-house scoring system manually. We began the search with these two guiding questions "does this system improve decisions and better outcomes for our clients?" AND "can we prove it?"
Our review of scoring systems led us down multiple rabbit holes of evaluation. It was clear to see that many scoring providers were confident in their approach and methodology, and that there was high overlap in watchlist output to what we were already producing. Almost all systems we evaluated we were unable to confidently answer "yes" to both of our guiding questions and may not be an improvement to our current practice. For example, the most popular scoring system available today belongs to Morningstar. Most layman investors are aware of Morningstar and their star rankings. But does their evaluation system answer "yes" to both of the questions? (Kudos to Morningstar for doing their own academic research evaluation and study!) They display the evidence that they cannot claim their star ranking (and newer Quantitative Rating) answers both as a "yes". You can read the study here.
 One scoring system we evaluated was able to demonstrate with independent verification that answered "yes" to both guiding questions: the fi360 Fiduciary Score®. fi360 Fiduciary Score® is an investment rating system used to evaluate open‐ended mutual funds, exchange‐traded funds (ETFs), and group retirement annuities on nine different criteria. The Score itself ranges from 0 to 100, with zero being the most preferable, and is calculated monthly for investments possessing at least three years of trading history. The quartiles of the score are colored Green, Light Green, Yellow, and Red. Green and Light Green are generally acceptable colors of the score. There are Nine Criteria Used in the Score:
- Regulatory Oversight
- Track Record
- Assets in the Investment
- Stability of the Organization
- Composition Consistent with Asset Class
- Style Consistency
- Expense Ratio/Fees Relative to Peers
- Risk Adjusted Performance Relative to Peers
- Performance Relative to Peers
There are then five different fi360 Fiduciary Score®:
- The fi360 Fiduciary Score® is calculated monthly for appropriate investments using the nine criteria above.
- fi360 Fiduciary Score® Average (1 year) is the rolling 12‐month average of fi360 Fiduciary Score®.
- fi360 Fiduciary Score® Average (3 year) is the rolling 36‐month average of fi360 Fiduciary Score®.
- fi360 Fiduciary Score® Average (5 year) is the rolling 60‐month average of fi360 Fiduciary Score®.
- fi360 Fiduciary Score® Average (10 year) is the rolling 120‐month average of fi360 Fiduciary Score®.
For more background information on the score methodology, please review here.
Complementing our Current Scoring and Evaluation with fi360 Fiduciary Score®
In a 2017 study by the Center for Financial Planning & Investment (CFPI) titled "Analysis of fi360 Fiduciary Score®: Red is STOP, Green is GO", economists affiliated with CFPI analyzed the observed relationship between “color groups” of fi360 Fiduciary Score® as predictors of future outcomes, and confirmed that the top groups (“Green” and “Light Green”) consistently provide better results than the other averages and categories in several dimensions. The economists ran 2.35 million fund-date observations utilizing the date-current (a.k.a. spot) Score. They then computed one-year, three-year, and five-year future annualized returns and forward standard deviation. They also evaluated the stability of each score. You can read the entire study here.
Here are the key points from the study that we highlight as crucial to our decision (all image captures are from the "Analysis of fi360 Fiduciary Score®: Red is STOP, Green is GO" study):
- Scores were predictive of higher returns in the future.
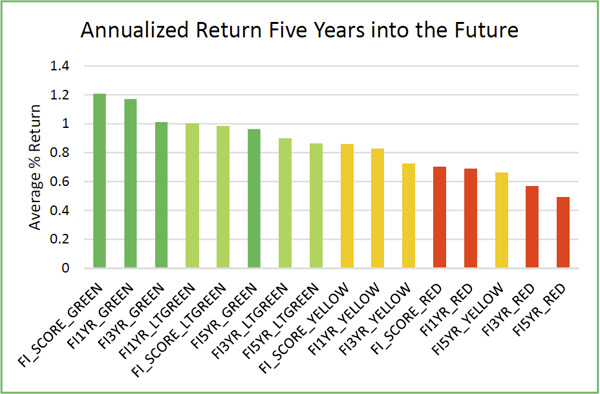
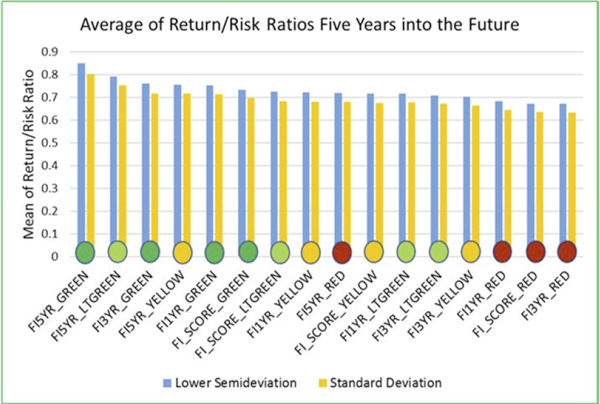
- Scores were predictive of higher risk adjusted returns in the future.
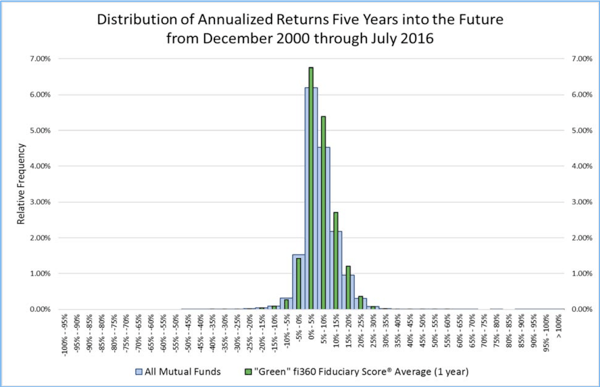
- The distribution of scores showed "green" funds versus the entire mutual fund universe.
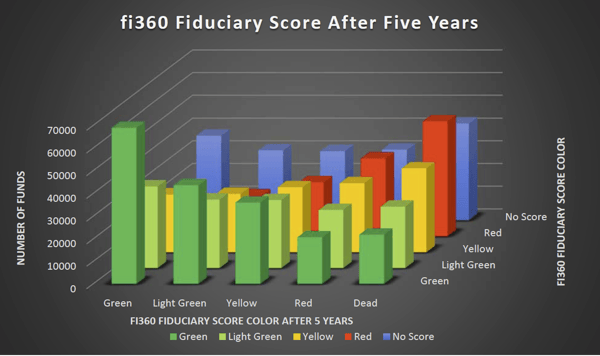
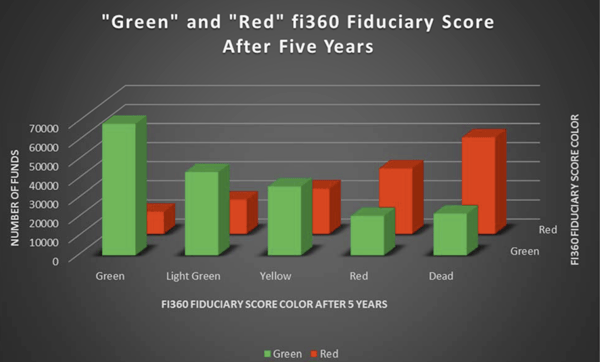
- The stability of scores in the next 5 year period.
- The stability of scores in the next 5 year period for only Green v. Red scores.
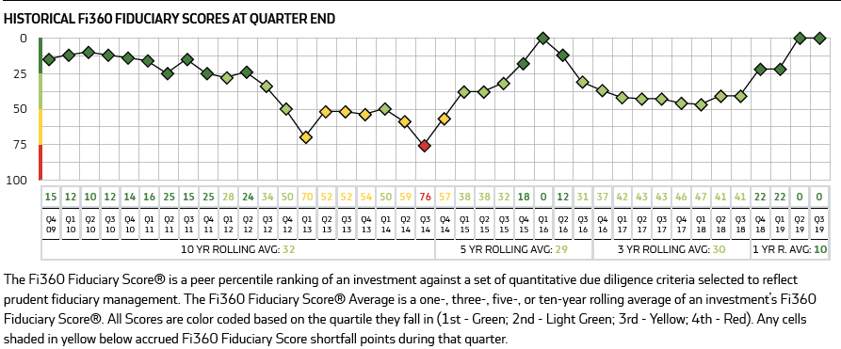
- Within the fi360 Report Toolkit, which our clients are accustomed to seeing currently, we're able to display to our clients persistence of scores AND the relative failure of the investment strategy with transparency in the underlying score.
Conclusion
As some of our clients ask that we provide custom screens, metrics, and scoring to help them better meet their investment fiduciary needs, adopting the fi360 Fiduciary Score® may not meet their requests. However, for many of our clients we believe adding the fi360 Fiduciary Score® as another data point to our client discussions will allow us to better our process and hopefully, outcomes. We always welcome a discussion where we can further explain our investment process and procedures ~ you can reach out to our team here.