

57% of 401(k) and 403(b) retirement plans offered a stable value or investment contract fund to participants in 2015, and 19% of participants offered this investment actually utilized the fund in their investment allocations, according to Vanguard's How America Saves. In total, retirement plan participants have invested nearly $780 billion in these types of vehicles. Retirement Plan Sponsors and participants like these investments as stable value, as the name implies, trades with a constant Net Asset Value (NAV), and pays an attractive yield relative to money markets. But what's the one question no one asks about Stable Value Funds?
How safe are stable value funds and what market conditions can cause them to fail?
In measuring the health of Stable Value, Guaranteed Insurance Contracts, and separate account funds, a key calculation to review is the Market Value (MV) to Book Value (BV) Ratio. The value at which investors typically buy and sell the fund is the book value which is smoothed by the fund’s contracts. The actual market value of the fund’s holdings can be volatile and differ substantially from the book value. Any time the fund recedes to a level less than 100% (when the fund’s book value exceeds the market value), the recovery to 100% is important. This is due to the increase of potential exposure to the credit worthiness of the fund’s wrap providers any time the market value of the investments underlying the stable value contracts is below the contract (or book) value. Additionally, when MV/BV is less than 100%, participant withdrawals will worsen the MV/BV ratio. For example, if MV = $100 and BV = $105 (MV/BV = 95.2%) and there is a participant withdrawal of $10, MV is now equal to $90, and BV is now $95. The MV/BV ratio is now reduced to 94.7%.
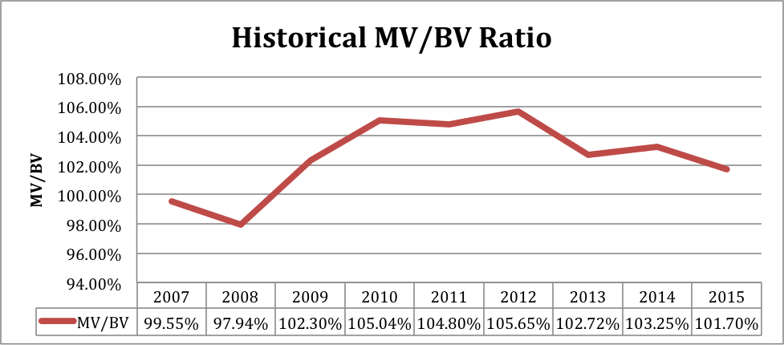
The problem with a Market Value below the Book Value is that a participant now has exposure to being made whole by the sponsoring organization or insurance contracts. As you'll see if the analysis above, the assets of the fund declined in 2007-2008 but also in this particular instance several insurers went bankrupt. Participants that wanted their stable dollar back were unable to do so at that time. An extreme market event prevented those participants who wanted little to no risk, found they had taken more risk than they had known. Also, what happens if interest rates rise perpetually? This may also impair the Market Value of the fund and create more pressure on the sponsoring entity's protection to make investors whole. These are but a few situations a plan sponsor must consider regarding the risk of their stable value fund.
To measure the health of Guaranteed Accounts and Annuities, the credit analysis is similar to the analysis performed on the Bank Savings Accounts. Many of these providers are insurers so the analysis may be a bit different in the manner of performance, but the overall end conclusions should be similar. One must perform a credit analysis of the sponsoring entity including the risks associated with the underlying investment portfolio or nature of the sponsor’s business. Capital ratios and whether they are improving or declining is a key metric to observe. Below is a sample analysis .
|
2014 |
2013 |
2012 |
2011 |
2010 |
2009 |
2008 |
2007 |
|
|
Total Assets ($M) |
$902,337.00 |
$885,296.00 |
$836,781.00 |
$796,226.00 |
$728,249.00 |
$537,531.00 |
$499,794.00 |
$559,149.00 |
|
Total Capital ($M) |
$72,053.00 |
$62,096.00 |
$64,837.00 |
$57,889.00 |
$48,996.00 |
$33,498.00 |
$23,985.00 |
$36,985.00 |
|
Capital as % of Total Assets |
7.99% |
7.01% |
7.75% |
7.27% |
6.73% |
6.23% |
4.80% |
6.61% |
Participants' safety net in this structure is the level of capital if losses are sustained in the general account assets. Basel III accords request that capital levels of financial institutions be no less than 8% to be considered well capitalized. As one can see in the above analysis, this example institution is just reaching this level.
Make sense? Now, there are other questions that are vital to evaluating the health of your stable value fund and considering all stable investment options for your plan. We hope this blog post provides you a solid framework you can follow if you're just getting started or if you're concerned about what you may be missing. If you want to read more on this topic, feel free to download our free The Risk Free Options are Changing - A Guide for Plan Sponsors eBook here.